All about the models.

This section is to give more information on which models were created. How they were assessed and trained and how they performed.

Projection models considered

For this project I considered two types of machine learning models. ANN and RFR. Below is a list of a few reasons why these were chosen for consideration.

ANN
  • Artificial Neural Network
  • Can capture complex, non-linear relationships
  • Can automatically learn relevant features from input environmental data, reducing the need for manual feature engineering
  • Highly flexible models and can adapt to different types of data
  • Can produce models with high predictive accuracy
  • Can effectively handle missing or incomplete data
  • Generalizes well
RFR
  • Random Forest Regression
  • Is an ensemble learning method
  • Can capture non-linear relationships
  • Can efficiently handle high-dimensional datasets and is less sensitive to multicollinearity among predictors
  • Difficult to overfit
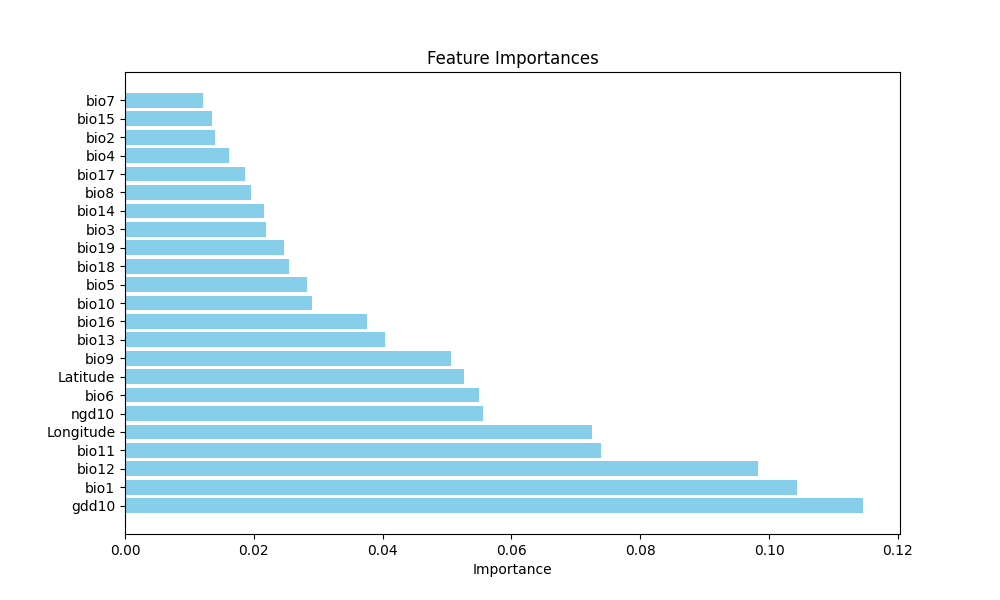
  • Provides a measure of variable importance
  • Relatively transparent and easier to interpret

Model performance

I created both models and ran it along with a grid search method to determine the best hyperparameters. 

ANN Hyperparameters

A grid search method revealed that the following resulted in the pest model performance:

  • Activation: relu
  • Alpha: 0.0001
  • Hidden layers: 3
  • Hidden layer sizes: 100, 50, 25
  • Solver: adam
RFR Hyperparameters

A grid search method revealed that the following resulted in the pest model performance:

  • Maximum depth: none
  • Maximum features: sqrt
  • Minimum number at leaf: 1
  • Minimum number to split: 5
  • Number of trees: 200
ANN Performance

Overall accuracy: 0.9611

Precision Recall f1-score Support
0 0.97 0.93 0.95 622
1 0.96 0.95 0.97 1051
RFR Performance

Overall accuracy: 0.9647

Precision Recall f1-score Support
0 0.96 0.94 0.95 622
1 0.97 0.98 0.97 1051
Model choice

Because the two models performed similarly, I chose to make my future occurrence predictions using the RFR model.

This was mainly because the futured data had a resolution of 30s, leading to incredibly large datasets. In order to reduce the time needed to extract all future climatic variables, the feature importances provided by RFR can reduce the amount that I had to focus on when creating my future datasets.

After examining the feature importances (graph shown below) I decided to include everything above 0.05 as below this point there is a substantial drop in importance per feature. For more information on what each of the chosen features are, you can look at the data page.