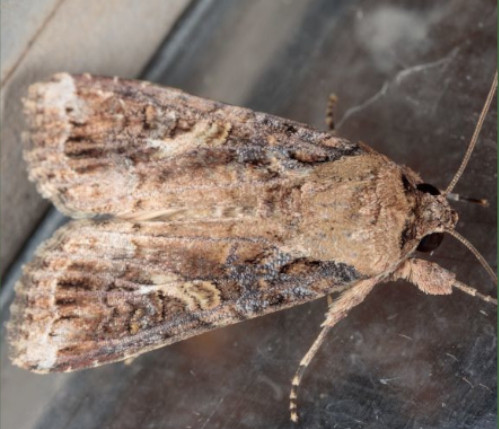
Spodoptera frugiperda - the fall armyworm
The fall armyworm is a Lepidopteran pest that feeds on the majority of crop species. It has been estimated that this pest can be responsible for up to 94% reduction in crop yield.
Native range
Tropical and sub-tropical regions of the Americas.
This range includes the United States to Argentina.
Potential spread
Starting in 2016, it has spread across the globe and is currently found in Africa, India, Southeast Asia, China, Australia and New Zealand to name a but few places.
Life history
This insect has four stages:
- Egg (100-200 laid per female)
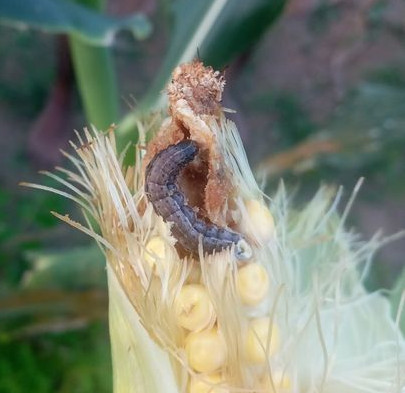
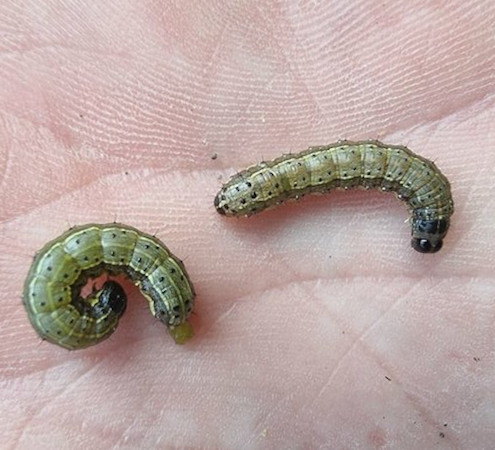
- Larva (caterpillar)
- Pupa
- Adult (moth)
During the larval stages these insects can inflict devastating crop losses through feeding on the foliage or fruits of a variety of crop species.
Adults are strong fliers and can disperse over long distances, especially during hotter periods of the year.
Impact
This species is of economic importance around the world as it can be devastating in a variety of crops, threatening access to food and sustainability.
Known hosts of the species list around 350 types of plants. These plants include a variety of major crops like maize, sorghum, cereals and rice.
With the potential to spread further and lay more viable eggs in areas where the environment can support growth, this threat will continue to increase.
Future climate change scenarios
For the purposes of this project, only three scenarios were considered. The best scenario (SSP126) was left out as it considers zero emissions from the projection date, which is unrealistic.
Optimistic scenario
SSP126
- 2.6 W/m2 by the year 2100
- Represents a future where sustainable development is prioritized, leading to a more balanced and equitable society
- There's a rapid transition to renewable energy sources, resulting in significantly reduced carbon emissions
- There is strong global cooperation and effective governance to address climate change and other global challenges
Moderate scenario
SSP370
- 7.0 W/m2 by the year 2100
- Represents a future where current trends continue without significant deviation, resulting in moderate development
- Energy use is diversified, with a mix of fossil fuels, renewables, and nuclear power. Carbon emissions continue to increase, but at a slower rate
- Global governance is characterized by moderate cooperation, with some efforts to address climate change and other global issues
Severe scenario
SSP585
- 8.5 W/m2 by the year 2100
- Represents a future where economic growth is prioritized over environmental concerns, resulting in intensive use of fossil fuels
- Fossil fuels remain the dominant energy source, leading to a sharp increase in carbon emissions and environmental degradation
- International cooperation is limited, with countries prioritizing economic interests over sustainability
Main project parts
The project was divided into four large parts: data collection, modelling and analysis and visualization. For more on each of these steps, follow the links below.
Data used
For more information on the data used in this project, where it came from, how it was cleaned and prepared, follow the link below.
Learn MoreModelling
Explanations on the modelling and model choices are given on a dedicated page. This includes the criteria for model choices, PCA and more.
Learn MoreAnalysis
All data needs to be interpreted to be understood fully. Maps with potential spread under all future climate scenarios were created.
Learn More